Reporting in Dynamics – Basic Charts and Dashboards
Using charts and dashboards included in the Playbooks Unmanaged solution
XANT provides an Unmanaged Solution that includes a set of charts and dashboards, allowing you to quickly gain improved insight into the activities your sales team is completing on a routine basis and the Plays that are driving your team strategy. Keep in mind that similar charts can easily be created without installing the Unmanaged Solution. Also, this Solution will add fields to your Lead, Contact, Phone Call, Email, and task Entity Forms. If you would like to take advantage of the canned charts and dashboard in the Unmanaged Solution, you can access the solution below.
Chart – Play Distribution
Using this chart you can evaluate what Plays are most utilized. This chart is especially helpful if the permission to create Plays is extended to all users. This allows Managers to keep track of the Plays being assigned to records.
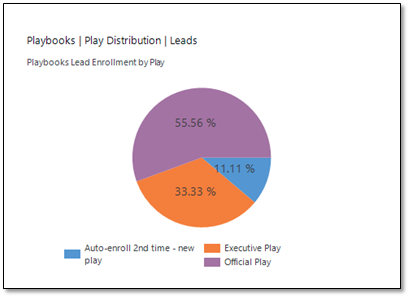
Chart – Play Status
This chart provides a manager number of records currently being worked, records yet to be actioned (or not started), and the records which have exited a Play (Success, Failure, or Unenrolled).
Identifying Success
If you double click to view the details of the records you can filter for records in a “Success” status. The Play Name will be displayed, and you can run analysis on successful Plays. Similarly, you can filter for your “Failure” records and make modifications to the Play’s cadence, cue cards, and email templates.
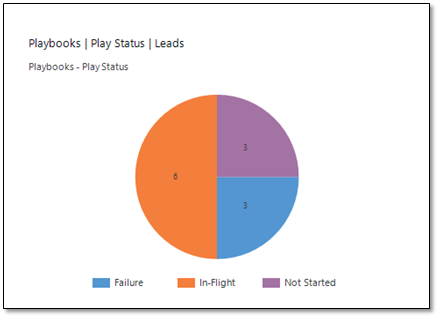
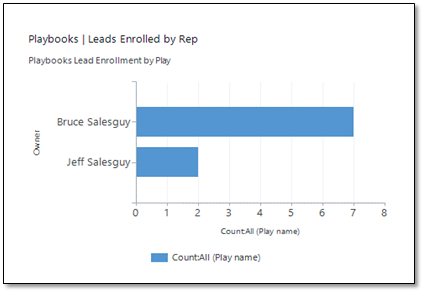
Chart – Leads Enrolled by Rep
When you initially launch Playbooks to your team, use this chart with no additional filters to track Playbooks adoption, verifying that Reps are adding records to Playbooks. After adoption stabilizes, you can add filters for specific Plays to report on Play compliance.
Dashboard – Playbooks Strategy
The above charts for both Leads and Contacts can be found in the Playbooks Strategy Dashboard.

Chart – Playbooks Calls this Week / Playbooks Emails this Week
The first step to hitting your sales goals is ensuring consistent daily effort from the team. The fundamental measurements of effort is dials per rep per day and emails per rep per day.
This report removes self-reporting and only includes activities made using Playbooks.
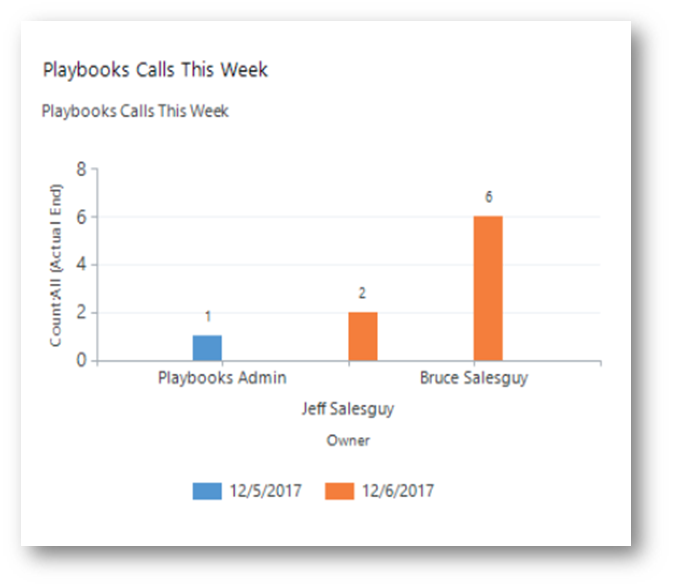
Chart – Talk Time This Week
Track how much time have your reps spent actually speaking with prospects.
Talk time gives insight into:
- Rep effort
- Properly structured schedule
- Lead quality
- Rep effectiveness / preparation / selling ability
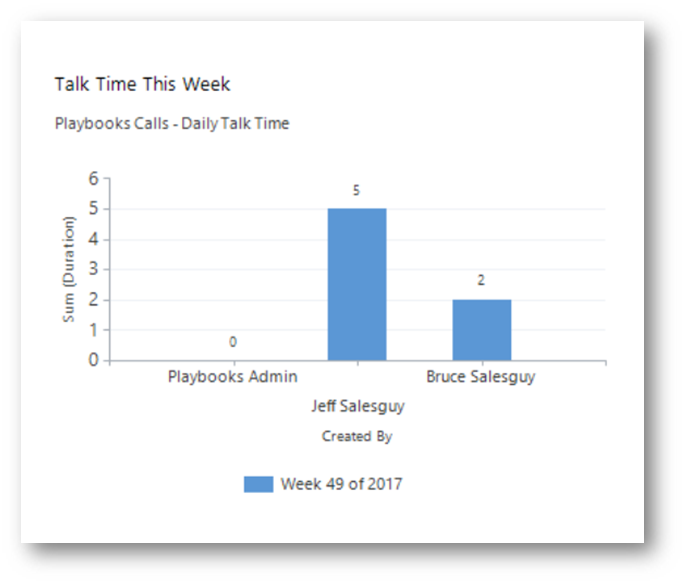
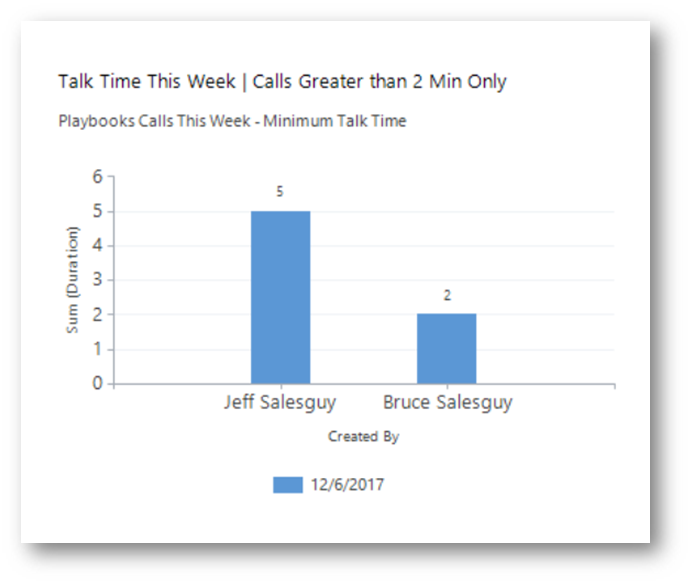
Chart – Calls Greater than 2 Minutes
Longer conversations are an indicator of high-quality calls or effective sales activities. This chart reveals conversations per rep this week.
View – Playbooks Call Recordings
Call recordings help reps to improve when used for self-evaluation, team training, and manager 1:1 coaching sessions. This view makes it easy to grab the URL and paste into your web browser.
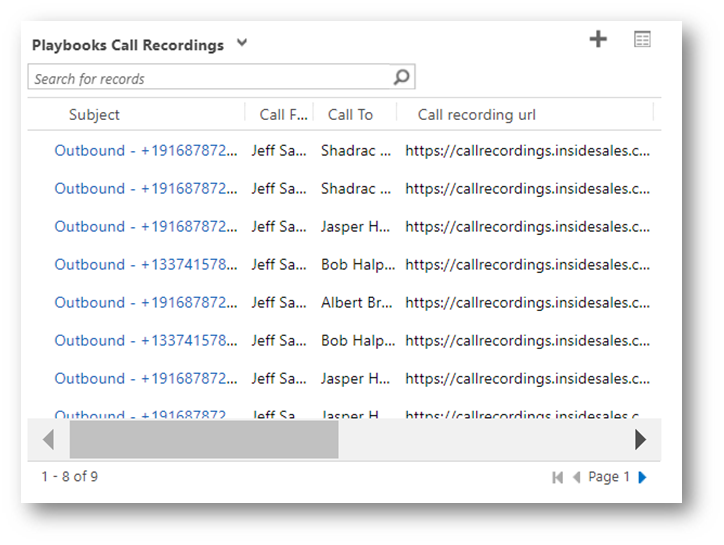
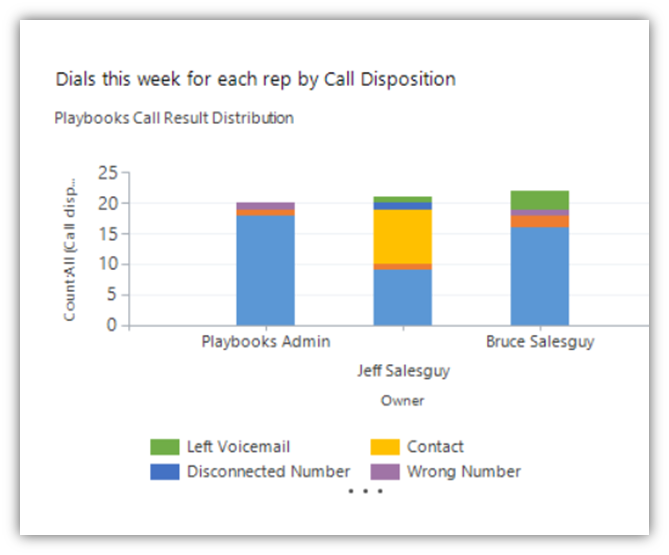
Chart – Call Disposition
This chart reports on what the call outcome was. Did they leave a voicemail or connect with the prospect? Was it a wrong number? Educate reps on accurate definitions of the Call Results for best data hygiene. Then use this chart when to diagnose proper use of the tool.
Dashboard – Playbooks Activities
This dashboard pulls it all together, allowing you to change date ranges as necessary to look for activities this week, last week, or custom ranges.